Air France Flight 447:A detailed meteorological analysis
by Tim Vasquez
Update / June 9, 2009:
I received an e-mail (see the comments page) from a scientist affiliated with the
NASA TRMM mission indicating that no lightning
was detected during a 90-second pass of the system that affected Air France Flight 447.
This agrees with evidence from the
WWLL sferic lightning network for that date.
A review of the literature confirms these findings and suggests that convective systems over the equatorial
oceanic regions do indeed exhibit an unusual lack of lightning activity.
In a 1993
paper
E. J. Zipser cites
"many examples of intense mesoscale systems, such as squall lines ... extending to 1317 km in altitude,
but that nevertheless produce few reports of lightning. This reinforces the idea, based on data from
other tropical ocean regions and from global satellite data, that in spite of the ubiquitous
'hot towers' over tropical oceans, marine cumulonimbus produce little lightning."
Furthermore, a recent paper also published by Zipser
(source)
underscored the dilution of updraft parcels in the lower portions of equatorial oceanic cumulonimbus clouds
while providing an excellent conceptual model for the cloud structure and ice particle
distribution that might have affected Air France 447.
Though lightning or electrical discharge effects cannot be conclusively ruled out, this set of evidence
makes it difficult to offer a coherent explanation predicated on those factors.
I have made some adjustments throughout this study to account for the new information.
Update / June 9, 2009:
A reader pointed out
Northwest Flight 705,
a Boeing 720 which broke up in a Florida thunderstorm in 1963, which has been mentioned in
this essay but not yet addressed.
So I decided to create proximity soundings based on the Miami radiosonde launch for
1200 UTC and
0000 UTC (crash time was 1930Z).
This incorporates a parcel constructed from the T=25C Td=22C conditions observed at Miami
and Homestead AFB earlier that morning which is in agreement with the mixed layer parcel moisture value
of about 16 g/kg on the
Key West
sounding.
Averaging the two it appears that a CAPE (instability) value of 1670 J/kg occurred with
these thunderstorms. It's also noteworthy that the parcel-environment temperature difference,
which gives an estimate of updraft severity, was 5 to 7 deg C at FL180-240, which was
slightly more than the 4 deg C seen on the AF447 sounding below.
Update / June 9, 2009:
Myself and Scott Bachmeier at University of Wisconsin/Space Science and Engineering Center
are requesting that airline pilots who observed a significant warming episode at cruise altitude
within the past 10 years and know the exact date/time and approximate location
please drop us an e-mail with the story
and include your credentials (which will remain anonymous).
Unfortunately we must have an exact date and time in order to research the event.
I have received a number of anecdotes from pilots who report encountering the phenomena,
and while neither of us see evidence yet which supports this occurring in the Air France 447
storm cluster we believe it's a good idea to research this further rather
than just dismissing it at this point. We appreciate your help.
Update / June 8, 2009:
It was brought to my attention (thanks Bill S.) that a 1979 episode of sudden upper tropospheric
warming has been quantified in the peer-reviewed literature
(see here, PDF).
Though I had ruled out sudden warming in earlier updates, I had only been considering
buoyant cumulonimbus ascent, in which case a 30-degree rise in the cloud would be unprecedented and
indeed unsupportable by the theta-e profiles in the air mass feeding the storm, though if it did
occur the vertical velocities and turbulence potential would be astronomical.
Though stratospheric "warm sinks" and "cold domes" have been a part of forecasting for years,
this paper proposes a very intense, small-scale, convectively driven downdraft mechanism caused
by the penetration of a mesoscale convective system into the stratosphere.
The paper identifies a scale of about 75 km in width and an anomaly of 18 Celsius degrees.
Any forced downward motion from the stratosphere like this will cause very strong adiabatic warming
and associated drying, characterized by a profound lack of high cloud layers and low radiance
on water vapor imagery (which by a stroke of luck is most sensitive to the upper troposphere).
Since a mesoscale signature like this is well within the sampling capability of the GOES and METEOSAT platforms,
I immediately reviewed the
water vapor
loop (SSEC). However it does not appear to show any anomalous subsident signatures.
The area to the north of the MCS appears to show normal synoptic-scale subsidence within the
trade wind inversion and the A330 is not believed to have made it this far north anyway.
I do have grave doubts a warm, mesoscale subsident area would be enough to significantly disrupt
the A330 flight, and occurring in clear air there is a good chance any failure would be recoverable.
I will however continue pondering this idea, will work this topic into the study,
and will be glad to entertain other thoughts in this direction.
The mystery continues.
-- Tim Vasquez
Weather Graphics / Norman, Oklahoma
Air France flight 447 (AF447), an Airbus A330 widebody jet, was reported missing in the equatorial Atlantic Ocean in the early morning hours
of June 1, 2009. The plane was enroute from Rio de Janeiro (SBGL) to Paris (LFPG). Speculation suggested that the plane may have flown into a thunderstorm.
The objective of this study was to isolate the aircraft's location against high-resolution satellite images from GOES-10
to identify any association with thunderstorm activity.
Breakup of a plane at higher altitudes in a thunderstorm is not unprecedented and should
not be confused with crashes due to low level wind shear (e.g. Delta Flight 191).
Some examples of inflight breakups are
Northwest Flight 705
which was downed at FL250 in the Everglades in 1963;
NLM Flight 431
which crashed in the Netherlands inside a thunderstorm; and
Pulkovo Aviation Flight 612, for
which deep stall was a significant compounding factor.
I did flight route forecasting for the Air Force in the 1990s. One of my assignments in summer 1994 was forecasting the sector between Mombasa, Kenya and
Cairo, Egypt for C-5 and C-141 aircraft. The Sudan region had tropical MCS activity similar to this with little in the way of sensor data,
so this incident holds some special interest for me as one of our C-5s could easily have followed a very similar fate.
Using what's available to me I decided to do a little analysis and see if I could determine anything about the fate of AF447
and maybe through some circuitous, indirect means help give authorities some clues on where to look.
1. Reports and evidence
Thanks to an anonymous contributor (thank you, sir!) I was given the flight plan for Air France flight 447, which is shown here.
This verifies against position reports that were published in the media Monday night.
|
Figure 1. Air France Flight 447 flight plan. (Source unknown)
|
Air France Flight 447 reported on HF radio that it had reached INTOL (S01 21.7',W32 49.9' or -1.362,-32.832) at 0133Z
and was estimating it would reach TASIL (N4 00.3',W29 59.4', or +4.005,-29.990)
in 50 minutes (a true track of 28.1 deg)
(source)
on oceanic high altitude route UN873 (see below).
|

Figure 2. Enroute High Altitude Caribbean and South America H-4, 30 AUG 2007 (National Geospatial-Intelligence Agency).
|
I decided to project the flight forward from INTOL. An altitude of FL350 and speed of 520 mph was given. Presumably this is ground speed
according to the ACARS specification. Compensating for a 10 kt headwind as given by the SBFN sounding this yields an airspeed of M.80,
which correlates well with the A330's typical early cruise profile. This yields the following extrapolated aircraft coordinates.
As of June 4 these estimates are still good and have not changed.
| Time | Coordinates | Description |
| 0133Z | -1.362,-32.832 | Reported INTOL |
| 0145Z | -0.033,-32.125 | Extrapolation |
| 0200Z | +1.629,-31.242 | Extrapolation |
| 0215Z | +3.290,-30.357 | Extrapolation |
| 0223Z | +4.150,-29.876 | Estimated TASIL |
| 0230Z | +4.951,-29.469 | Extrapolation |
|
|
Figure 3. Projected flight coordinates..
|
2. Meteorological analysis
Surface analysis showed the suspected crash region to be within the intertropical convergence zone (ITCZ), which
at this time of year is usually found at about the 5-10N parallel. A region of strong trade winds covered most of
the tropical North Atlantic and this kept the ITCZ in a somewhat southerly position.
The linear convergence along the ITCZ and the unstable atmospheric conditions combined to produce scattered clusters
of thunderstorms.
|
Figure 4. Surface analysis for 0000Z. (NCEP)
|
The upper level charts were absolutely devoid of observed data in the equatorial Atlantic region except for the
balloon launch from SBFR and a few ACARS reports from transoceanic flights.
See
250 mb,
500 mb,
700 mb, and
850 mb.
Most of the wind barbs seen here are from satellite estimates and a few others are from ACARS inflight reports (starred symbols).
The aircraft temperatures here are not regarded as the FL330 reports near SBFR show poor correlation with the 33.1 deg C
value obtained from the SBFR balloon launch.
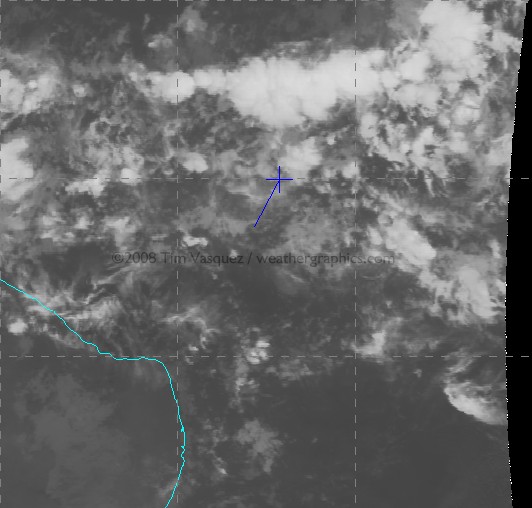
Using McIDAS I acquired satellite GOES-10 satellite data from UCAR and centered it over the region between INTOL and TASIL.
I then plotted the waypoints using McIDAS's built-in coordinate entry panel. Since the source satellite images are
georeferenced NOAA/GINI datasets,
the points shown here are very accurate and are NOT placed by hand but by lat/long coordinates to the
nearest 0.001 deg (0.06 mile).
In the image below, the stationary southerly point in blue is INTOL and the aircraft's estimated location from the above
table is marked with a cross. Graticule spacing is 5 degrees.
For the orange temperature plots I used the NCL/3aw curve; the sharp gradient of the enhancement from dark to
light occurs at 243K (-30 deg C), indicating a cloud top of FL310 assuming the satellite pixel is completely overcast
with that layer (which is not always true).
Raw infrared images are also available here:
0145Z,
0200Z,
0215Z,
0230Z.
And finally this image shows a zoomed image at 0215Z when AF447 made its last transmission:

Figure 6. View of AF447 track using GOES imagery, 0215Z 1 June 2009. GOES-10 is
located at the 60 deg meridian.
|
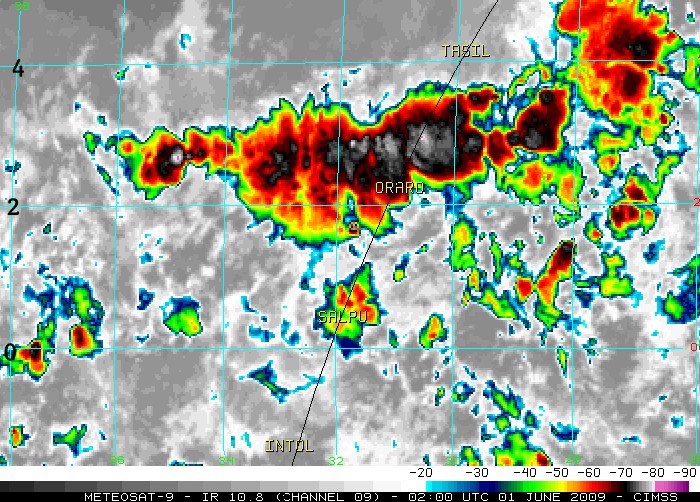
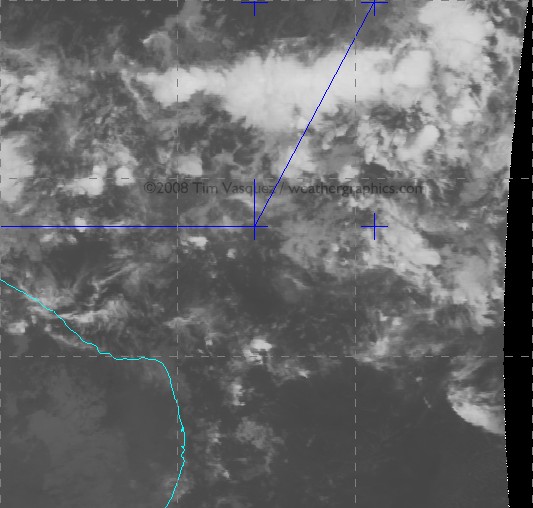
Figure 7. View of AF447 track using METEOSAT-9 imagery, 0200Z 1 June 2009. This satellite is positioned
over west Africa at the 0 deg meridian. The image shows slightly different characteristics
since the satellite is positioned east of the MCS rather than west of it. The image is also 15 minutes earlier.
(Special thanks to Scott Bachmeier and SSEC at the University of Wisconsin; also to
EUMETSAT for making the image possible)
|
The resulting satellite photos clearly show an active mesoscale convective system (MCS) across the flight path.
About 90% of the cloud material seen on the closeup images are actually multiple levels of convective debris fields from dying storms and
activity that occurred previously during the day, with extensive cirrus fields.
The active thunderstorm areas are actually defined not by the bright coloring but by small-scale mottled areas of cold cloud tops.
Compare with this structural diagram below of a similar tropical MCS in the same area in 1977.
Temperature trends suggested that the entire system was at peak intensity, developing rapidly around 2300-0100Z
and finally dissipating many hours later around dawn. From a turbulence perspective, the
cold spots described above would be the areas of
highest concern as they signal the location of an active updraft producing new cloud material in the upper troposphere.
I've taken a look at some of the new METEOSAT data posted by Scott Bachmeier and it refines some of what we've seen on GOES.
The mesoscale convective system is made up of numerous cell clusters.
Due to the northerly winds aloft the downdraft areas are carried southward.
As a result, the MCS has organized into a configuration with a dominant stratiform area to the south
and updraft area on the north side.
Also here are some distance/temperature diagrams prepared by Scott Bachmeier:
0130Z,
0145Z,
0200Z,
0215Z
along INTOL to TASIL at different times (temperature in deg K)
indicating that the minimum cloud top temperature along the flight route averaged -78 deg C (55,000 ft).
On June 5 I also received these satellite photos from the Naval Research Laboratory showing satellite signatures,
but have not yet assimilated them into my analysis or created captions yet since I just got them:
GOES-12 GCD,
GOES-12 CTOP,
GOES-10 IR,
GOES-10 CTOP,
GOES-12 IR. Many thanks to NCAR and the Naval Research Laboratory, including Jeff & Rich at NRL,
for these images; their message is in the comments and you can visit their website at
http://www.nrlmry.navy.mil/sat_products.html.
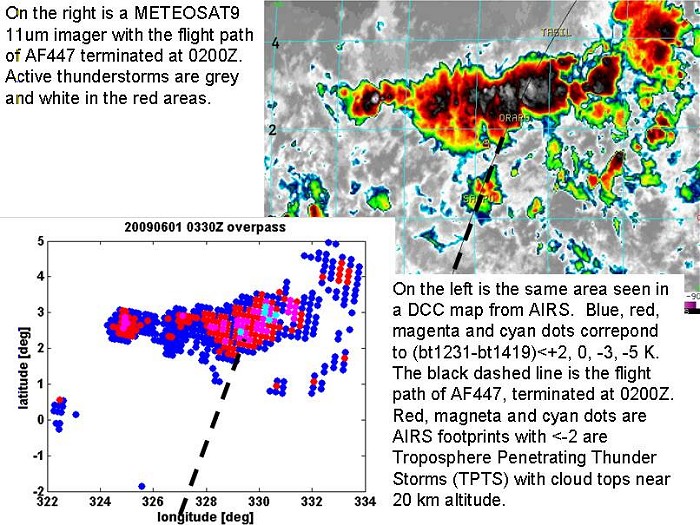
On June 5 I also received Atmospheric Infrared Sounder data courtesy of George Aumann at the Jet Propulsion Laboratory
METEOSAT_AIRS_DCC.analysis_sm.jpg, showing
the extent of thunderstorm overshoots in the MCS.
|
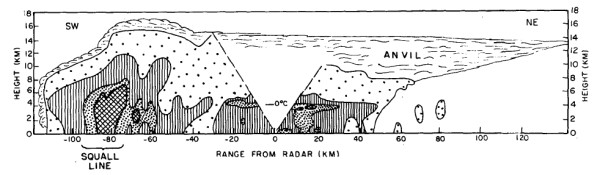
Figure 8. Schematic of a typical tropical MCS observed in the Atlantic southwest of Dakar on 4 Sep 1974.
(Structure and Dynamics of a Tropical Squall-Line System, R. A. Houze Jr., Mon. Wea. Rev., 105, 1540-1567)
|
Above we see an example of the structure in a typical MCS, this one observed on a shipboard experiment in the
same general area 35 years ago. It gives some idea of what the aircraft was probably flying through and shows
the vertical radar structures that can be expected.
* Thermodynamic conditions.
In order to obtain a representative parcel for the MCS, it's important to get as accurate a collection of
surface and upper observations as possible. Unfortunately the coverage of upper air data was extremely poor.
However at the surface, several merchant marine ships and buoys were located in the area.
They show a highly homogenized maritime air mass with a predominant temperature figure of 27.0 deg C.
This is in equilibrium with the reported sea-surface temperature of 27-28 deg C.
There is one report of 23 deg C in rain-cooled outflow air reported by the Jo Cedar ship.
The mesoscale analyses also indicates predominant dewpoint temperatures of 23.5 to 24.0 deg C.
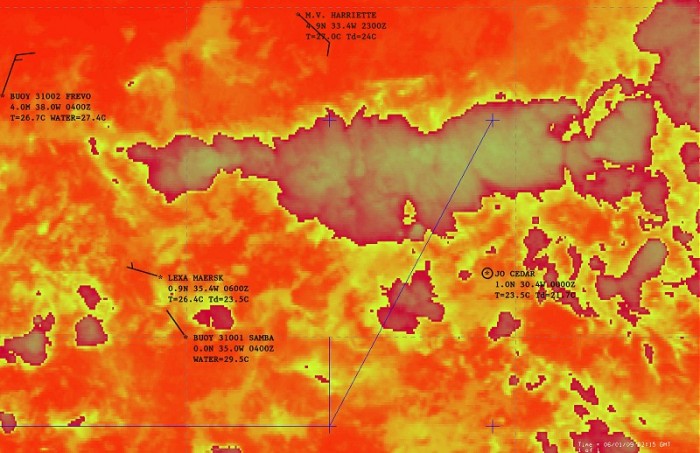
Figure 9. Mesoanalysis of buoy and ship reports for 00Z
with GOES IR.
|
Figure 10. Worst-case SKEW-T and parcel lift.
|
* Worst case instability.
The "worst case" sounding scenario would be the sounding shown above
for Fernando de Noronha (SBFN/82400) using a parcel constructed with the dominant 27.0C air
temperature observed for that region and for a 23.7 deg C dewpoint, exactly as observed. This yields about
the maximum amount of equivalent potential temperature that can be obtained given the atmospheric conditions.
The problem is that this method accounts for zero mixing of the parcel, which is unrealistic given the drier
air above 2000 ft AGL. The worst-case method also produces extensive -80 deg C overshoots, which were not observed.
Since this method yields 1500 J/kg of CAPE, it is believed that CAPE values were not in this range.
Figure 11. Most probable SKEW-T and parcel lift.
|
* Most likely instability.
Above shows the most-likely parcel as plotted on the Fernando de Noronha (SBFN/82400) sounding for 0000Z.
A parcel was constructed that just barely achieves the isolated -80 deg C overshoot temperature detected on METEOSAT imagery.
This was readily accomplished with a surface temperature of 27 deg C and dewpoint of 23 deg C (thus it realistically accounts
for a certain amount of boundary layer mixing).
* Instability values
The CAPE value obtained is 1067 J/kg, which by textbook definition is considered marginal for severe weather and
typical for the tropics.
That is not to say it does not have severe weather risks, as the formula for typical maximum observed updraft velocity is:
w=0.5*((2*CAPE)^0.5) which in this case gives 23 m/s (51 mph).
It is probable that even this amount of instability was not observed, due to the potential for extensive mixing
with an average dewpoint of 18C in the lowest 150 mb.
Furthermore, researcher Ed Zipser and others in their studies of oceanic equatorial cumulonimbus clouds
emphasize the dilution of updraft strength in the clouds they sampled, though this mainly occurs
below about FL200. This mid-level weakness probably contributes in some way to the lack of charge separation
and electrification (i.e. lightning).
Above that level, ice-filled updrafts are warmed by latent heat of sublimation,
restrengthening the updraft relative to the surrounding environment and this allows the
updraft to regain momentum and the cumulonimbus cloud to reach the stratosphere.
Zipser states that updrafts are usually strongest
in the upper troposphere compared to lower levels and updraft velocities of 20 to 40 kt
do occur occasionally. The role of a strong updraft or turbulence within the storm
cannot be completely ruled out, especially since METEOSAT measurement shows that
cumulonimbus overshoots reached at least 6,000 ft above the tropopause. This supports
the parcel buoyancies indicated in Figure 11 (most probable parcel) at flight level
but probably not in the lower part of the storm.
* Cumulonimbus tops.. Based on the soundings above, my conclusion is that the maximum cumulonimbus tops were 56,000 ft
with an equilibrium level of 47,000 ft, representing the tops of most parts of the MCS except near the edges.
This agrees fairly well with the observed METEOSAT thermal data.
3. Summary of flight conditions
The satellite imagery indicates that numerous cumulonimbus towers rose to at least 56,000 ft, and were
embedded within extensive stratiform anvils with tops ranging from 35,000 to 45,000 ft.
This kind of configuration is actually quite normal for equatorial storms due to the higher tropopause height, but it emphasizes
that the aircraft was certainly within the bulk of an extensive cumulonimbus cloud field for a significant amount of time
and that storms could indeed have been a contributing factor to the crash.
|

Figure 12. Probable radar depiction (green/yellow/red shading) based on thermal signatures and conceptual MCS models.
Units are arbitrary approximations of radar strength ranging from green (weak) to red (strong).
|
Above is a chart posted in my June 3 update showing the hypothesized radar depiction. This is based on careful enhancement of cloud
temperature information.
This is just an assumption of course but this is the best guess based on my own experience and
the satellite signatures available. It assumes that significant precipitation production is occurring in and around
the cold cloud tops, with warmer cloud tops correlating to decaying downdrafts or clouds with little precipitation.
Much of the analysis presented here and elsewhere in this article
is based on the aircraft's filed flight track, which it would be following faithfully via its internal reference system
except for minor deviations.
The distance between INTOL (0133Z,-1.361,-32.831) to the airplane's final reported ACARS position (2014Z,3.578,-30.374)
yields a distance of 331.5 nm (381.5 sm) (calculator) in 41 minutes.
This introduces consistencies because it yields a ground speed of 485.1 kt (558.3 mph), and at FL350 an airspeed of 288 KIAS/M.841
(calculator).
[Thanks to Barry Carlson for pointing out an error in previous versions; also see his position analysis at
http://countjustonce.com/af447/
]
This is excessive, because AF447 filed for M.82 and would have slowed to M.80 for turbulence penetration.
Furthermore based on synoptic scale analysis the plane should have had a 5 to 10 kt headwind for the majority of the route, slowing the
groundspeed slightly.
Thus the actual airspeed accounting for the headwind would be roughly M.855/293 KIAS.
The other distinct possibility here, assuming the final ACARS report time can be trusted, is a discrepancy between the INTOL reported
time and the actual crossing time; the HF call may have introduced one or two minutes of error, which would change these airspeed values by 5%!
This begs the question of how exactly the INTOL crossing time was obtained and whether it could be in error -- perhaps an airline
pilot here can help figure this out.
Since the final ACARS position lies slightly west of track UN873 it suggests that perhaps the crew was deviating a few
degrees left of the route to avoid the heaviest weather. It was indeed this cell near UN873 (with large red shading)
that produced the coldest tops, -80 deg C, on METEOSAT imagery, suggesting a top of at least 56,000 ft.
|
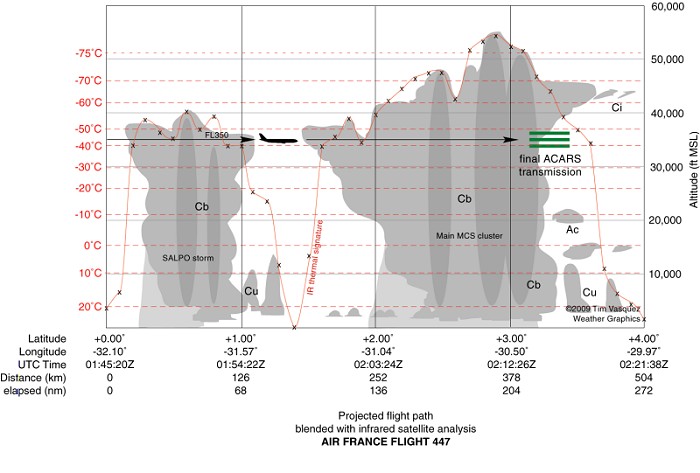
Figure 13. Cross-section of Air France 447 flight track through thunderstorm cluster, based on satellite imagery analysis
and conceptual MCS models. Light shading is precipitation near the surface; medium shading is cloud material, and dark
shading is suspected updraft areas.
The flight may have deviated several miles west to avoid the SALPO storm; whether they did or not is unknown; but they
almost certainly went through the bulk of the MCS as shown here.
©2009 Tim Vasquez. Not for free reproduction in commercial news outlets, sorry; it represents too much
original work.
|
The cross section graphic (Figure 13) above shows my best reconstruction of what the aircraft was likely encountering. Of course this is
centered on the planned track from INTOL to TASIL, and the suspected final ACARS call at 2014Z is shown in the zone hatched
in green. Again this is shown as a zone rather than a specific point because of inconsistencies in the coordinate data.
|
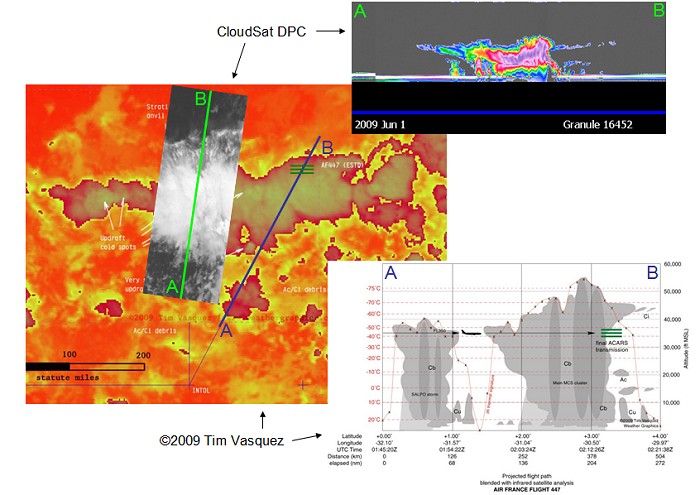
Figure 14. Cross-section of MCS from NASA CloudSat. Special
thanks to Phil Partain for this graphic.
Says Mr. Partain: "One hour and forty-five minutes after
the flight's last automated message, CloudSat, a NASA satellite
mission that carries a nadir-looking 94 GHz cloud radar passed
over the same MCS just to the west of your estimated flight track.
The bright line below cloud level is the reflection of
the radar off the ocean surface.
In areas of heavy precipitation the signal is attenuated as indicated
by the disappearance of the surface and anomalous returns extending
below the surface caused by multiple scattering of the
radar beam. Obviously the heaviest precipitation and strongest
updrafts are on the northern side of the storm evidenced by
the radar signature at the surface and strong in-cloud
echoes extending to or through the tropopause."
Full comment with more details is found below on the comments page.
(Courtesy NASA CloudSat Project and the Cooperative Institute for Research in the Atmosphere)
|
4. Conclusions
I've edited this section Monday night to cut down on the speculation about the accident chain, especially since I don't
know a whole lot about A330 systems. The airliners.net board and other sites cover the aircraft, CRM, and systems quite well.
What I will try to do, however, is summarize what the aircraft probably encountered based on the data and my own experience.
Also most of what is indicated here assumes a known cruise altitude of FL350 and that the plane did not descend for
other reasons.
* Turbulence --
Ed Zipser's expert work with tropical thunderstorms emphasizes the
dilution of updraft strength in oceanic cumulonimbus clouds, and tends to agree with
the lack of lightning signatures on sferic and spaceborne observing systems.
Turbulence however cannot be altogether ruled out as in the same studies Zipser indicates
that the updraft is slowed primarily in the low-levels of the storm and regains its
upward momentum as all of the updraft air sublimates or freezes into ice, which would
occur well below flight level.
Therefore severe turbulence at flight level still appears to be a possibility.
Strong turbulence can also occur around the periphery of a storm due to evaporative effects along the
the anvil cloud and vertical motion gradients within the storm tower.
* Lightning -- Though in earlier versions of this study I had identified lightning as
occurring in this mesoscale convective system, recent evidence from spaceborne and sferic sensors
is pointing to the possibility that this system contained no lightning.
Soundings do indicate moderate levels of instability,
but there are indications in the literature that cumulonimbus clouds in oceanic equatorial
regions entrain considerable quantities of drier, cooler air that dampen upward vertical
motion in the lower portions of the storm, and in some way this reduces charge separation.
In any case it does look fairly likely that we can rule out a lightning strike as being
a factor in the A330 crash.
* Icing (supercooled water) -- With a flight level temperature of -40 deg C suggested by the
proximity sounding the A330 would be exposed mainly to frozen ice particles and perhaps graupel.
Unbelievably however I neglected to mention the contribution of latent heat, which would immerse the
aircraft in -36 deg C air when crossing atop an updraft.
Supercooled water is usually rare at these temperatures
(see here for an explanation)
though a couple of expert commenters below have presented different views on the subject.
However studies of tropical cumulonimbus clouds over the oceans (Zipser et al) indicate that
supercooled liquid water at FL350 (and thus icing in general) is highly unlikely.
* Precipitation and ice -- A dual engine flameout due to precipitation or ice ingestion is a noteworthy possibility as
has been discussed on other sites (specific to the A330 type too).
Due to the high water vapor content in the tropics, tropical weather systems can contain exceptionally high values of precipitable water content.
The plane, if at FL350, was experiencing flight level temperatures of between -41 and -36 deg C.
Supercooled water is considered to be exceptionally rare or insigificant at temperatures below -30 deg C, but if it
does occur it does present the possibility of aggravating airframe and engine icing.
It does not appear, however, that supercooled liquid water could have been present at FL350.
Overall the plane appears to have been mostly in an area of ice crystals with possibly some graupel
at flight level.
* Hail -- I got a few comments about hail. Due to the marginal instability and the strong parcel
dilution of oceanic equatorial storms with reduced vertical velocities in the lower half of the
storm, damaging hailstones appear to be extremely unlikely.
Air France 447 would be far above the level where such particles would grow.
Finally one consideration speed is the absolute maximum hailstone size theoretically supported by a 23 m/s updraft (1067 J/kg CAPE) is
about 4 cm; the relation is given by Vt=AD^0.5, where D is the diameter in cm, A is an empirical value (about 11.4), and
Vt is the fall speed in m/s.
The actual vertical velocities in this storm, especially below about FL250, are likely to be
much lower than this figure.
* Warm sink -- One theory that has emerged is that the plane suddenly encountered an area of
relatively warm air, such as a temperature change from -40 deg C to -20 deg C, which suddenly exposes
the plane to air with different density, changing its position in the flight envelope and
conceivably causing a loss of control.
Such warming is not possible in the updrafts that Air France 447 encountered due to the lack of parcels
with extreme values of equivalent potential temperature (the maximum temperature I calculated was -36 deg C),
but rather could be caused by sinking of stratospheric air around the margins of the storm.
This effect has been known for decades, occurring at very large scales (many hundreds of miles), but
anecdotal reports exist of warm sinks on localized scales (tens of miles) with temperature
contrasts strong enough to have an effect on flight operations.
Fortunately such an incident was quantified in the meteorology literature 30 years ago
(Holland et. al.
, Mon. Wea. Rev. [112], 1979) (PDF).
The proposed mechanism is that upper-tropospheric sinking motion occurs due to some sort of
forced circulation caused by the thunderstorm's overshooting tops and the plane would encounter
it in the clear air around the periphery of the storm.
Any sort of intense adiabatic subsidence like this is accompanied by very strong drying and would
be observable not only on coarse infrared
imagery but also water vapor imagery, which is sensitive to the upper troposphere.
Myself and Scott Bachmeier at UW/SSEC have examined infrared and water vapor images of the June 1 storms,
however, and
have not yet found any signatures which suggest this happened in the case of Air France 447.
Overall what we know for sure is weather was a factor and the flight definitely crossed through a thunderstorm complex.
There is a definite correlation of weather with the crash.
However the analysis indicates that the weather is not anything particularly exceptional in terms of instability or storm structure.
It's my opinion that tropical storm complexes identical to this one have probably been crossed hundreds of times over the years by
other flights without serious incident.
Still, in the main MCS alone, the A330 would have been flying through significant turbulence and
thunderstorm activity for about 75 miles (125 km), lasting about 12 minutes of flight time. Of course anything
so far is speculation until more evidence comes in, and for all we know the cause of the downing could have been anything
from turbulence to coincidental problems like a cargo fire.
My own opinion of the crash cause, as of Monday night, based on the complete lack of a HF radio call and consideration of all of the above,
suggests severe turbulence
(see the BOAC 911 and
BNF 250 tragedies)
combining in some unlikely way with CRM/design/maintenance/procedural/other deficiencies to trigger
a failure cascade.
We can almost certainly count on some unexpected surprises once the CVR is recovered.
Until then, all we can do is await the investigation and hope that the world's flight operations stay safe until AFR447's lessons are revealed.
A few of the topics being discussed include:
* "Air France plane broke up in mid air" by guggi
* "Summary of my understanding of investigation thus far" by mars
* "Pitot Icing, Spillover, Flutter, FBW and Sailplanes" by LeoM
* "ACARS Messages" by AvBuff
* "Global long range radar coverage, transponders and pilot Wx radio" by north
©2009 Tim Vasquez / All rights reserved
|


