Air France flight 447 (AF447), an Airbus A330-203 widebody jet carrying 228 passengers, disappeared over the equatorial Atlantic Ocean during the early morning hours of June 1, 2009. The plane was enroute from Rio de Janeiro (SBGL) to Paris (LFPG). Early speculation suggested that the plane may have flown into a thunderstorm. The objective of this study was to isolate the aircraft's location against high-resolution satellite images to identify any association with thunderstorm activity. Breakup of a plane at higher altitudes in a thunderstorm is not unprecedented and should not be confused with crashes due to low level wind shear (e.g. Delta Flight 191). Some examples of weather-induced inflight breakups at higher altitudes are Northwest Flight 705 which was downed at FL250 in the Everglades in 1963; NLM Flight 431 which crashed in the Netherlands inside a thunderstorm; and Pulkovo Aviation Flight 612. This study was significantly updated on June 1, 2011 in memory of the 2nd anniversary of the crash. Also it was precipitated by the renewed interest in the fate of the flight with the data recorders having been recovered a few weeks ago. Interestingly it appears that almost all of the conclusions in my earlier study were correct. The purpose of this update is to introduce some new information, make corrections where necessary, edit extraneous theories that can now be disregarded, and clean up the text a bit.
As far as my background,
I did flight route forecasting for the Air Force in the 1990s. One of my assignments in summer 1994 was forecasting the sector between Mombasa, Kenya and
Cairo, Egypt for C-5 and C-141 aircraft. The Sudan region had tropical MCS activity similar to this with little in the way of sensor data,
so this incident holds some special interest for me as one of our C-5s could easily have followed a very similar fate.
Using what's available to me I decided to do a little analysis and see if I could determine anything about the fate of AF447
and maybe through some circuitous, indirect means help give authorities some clues on where to look.
1. Reports and evidence (updated June 2011)Early on in this study I was given the flight plan for Air France Flight 447 by an anonymous contributor, which is shown here. This shows that the crew had filed for route UN873 across the Atlantic.
Air France Flight 447 reported on HF radio that it had reached INTOL (S01 21.7',W32 49.9' or -1.362,-32.832) at 0133Z (according to ACARS/AOC or ATC) and was estimating it would reach TASIL (N4 00.3',W29 59.4', or +4.005,-29.990) in 50 minutes (a true track of 28.1 deg) (source) on oceanic high altitude route UN873 (see below).
One problem in this analysis is that BEA's reports have generally omitted location coordinates.
This complicates the task of resolving the aircraft track to weather patterns.
However, the ACARS AOC (Airline Operation Communication) log
(source)
was either released or leaked at some point since the crash.
An analysis of this log showed excellent correlation with a detailed analysis conducted on the
BEA graphical plot (pg. 4, 5/27/2011 BEA report). The ACARS/AOC log yields a ground speed of 471 kt, which compared well with the flight data recording
that indicated a speed of M.82 (490 kt TAS) and suggests a 19 kt headwind, which in turn compares well to my own estimate of a 10 kt headwind.
The voice transcripts indicating waypoint reporting times were discredited due to inconsistencies, most notably because with waypoints at 122 nm
intervals, the plane would require 15 minutes to traverse each leg without a headwind and times of 12-13 minutes were given.
Also the ACARS/AOC log shows the left deviation discussed in the cockpit voice recorder, and is consistent with locations given in BEA graphics
in earlier releases.
Therefore, this study is predicated on the following detailed summary of events, which has changed slightly from my 2009 report:
2. Meteorological analysis (updated June 2011)Surface analysis showed the suspected crash region to be within the intertropical convergence zone (ITCZ), which at this time of year is usually found at about the 5-10N parallel. A region of strong trade winds covered most of the tropical North Atlantic and this kept the ITCZ in a somewhat southerly position. The linear convergence along the ITCZ and the unstable atmospheric conditions combined to produce scattered clusters of thunderstorms.
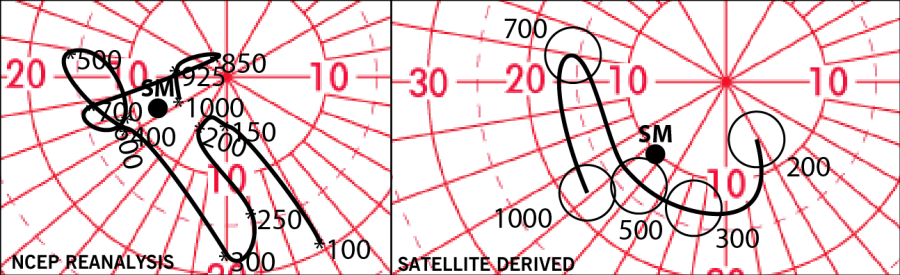
The upper level charts were absolutely devoid of observed data in the equatorial Atlantic region except for the
balloon launch from SBFR and a few ACARS reports from transoceanic flights.
See
250 mb,
500 mb,
700 mb, and
850 mb.
Most of the wind barbs seen here are from satellite estimates and a few others are from ACARS inflight reports (starred symbols).
The aircraft temperatures here are not regarded as the FL330 reports near SBFR show poor correlation with the 33.1 deg C
value obtained from the SBFR balloon launch.
Satellite display software with accurate geolocation capabilities was used to analyze data from the GOES satellites operated
by NOAA. The archives from EUMETSAT's weather satellite constellation did not arrive in time for this 2011 update.
Using the satellite data we obtain these graphics:
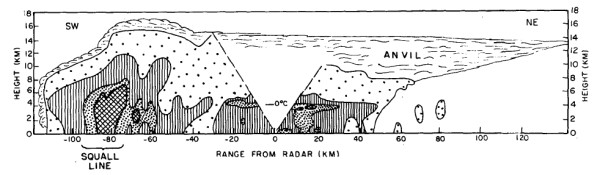
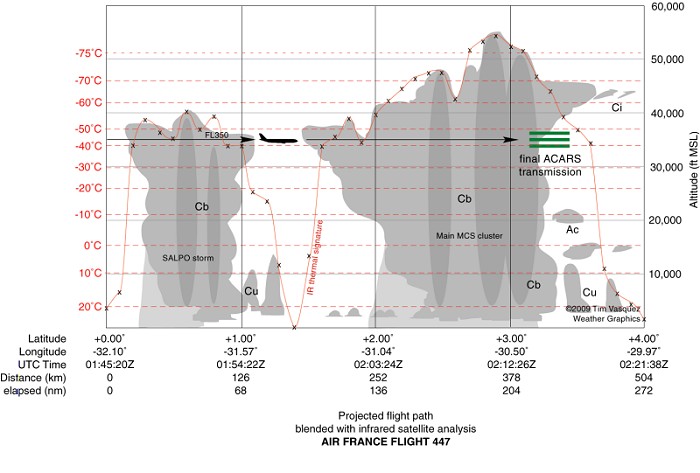
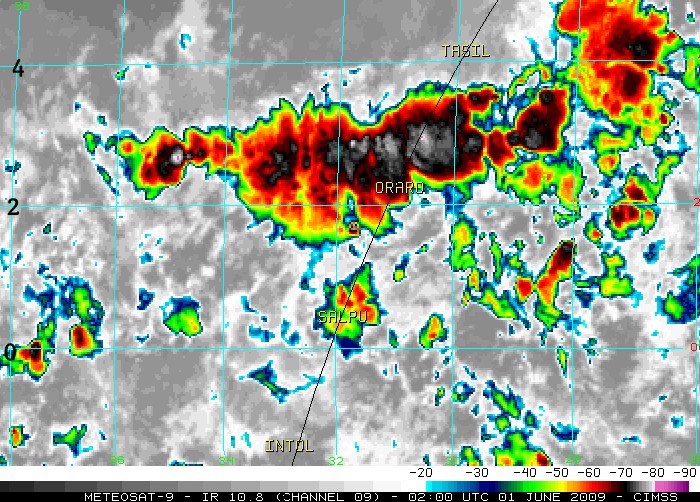
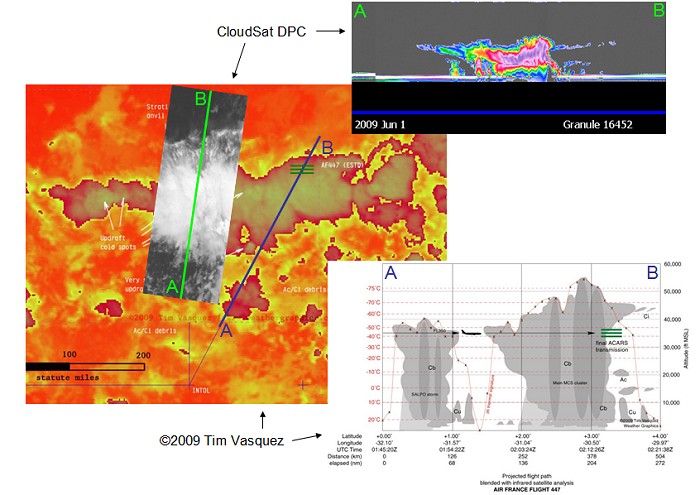
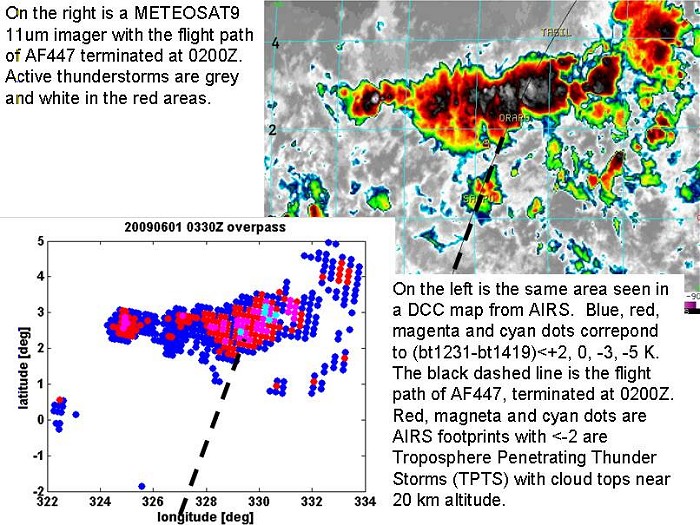
The resulting satellite photos clearly show an active mesoscale convective system (MCS) across the flight path, which had developed rapidly around 2300-0100 UTC. About 90% of the cloud material seen on the closeup images are actually multiple levels of convective debris fields from dying storms and activity that occurred previously during the day, with extensive cirrus fields. The active thunderstorm areas are actually defined not by the bright coloring or the cloud shield but by small-scale mottled areas of cold cloud tops. Compare with this structural diagram below of a similar tropical MCS in the same area in 1977. From a turbulence perspective, the cold spots described above would be the areas of highest concern as they signal the location of an active updraft producing new cloud material in the upper troposphere. Identification of actual thunderstorm cells is difficult, and can only be found where a pixel cools with time, and which is not part of a large-scale area of cooling and is not explained by advection. Unfortunately this can only be analyzed subjectively. Based on this, it appears that the northern edge of the actual precipitation was at about 3.0 to 3.1 deg N, which coincides with the furthest point reached by the airplane before impact. Analysis of satellite animation showed the development of new cells mainly on the northeast side of the cluster. All new updrafts produced upper tropospheric cloud material which advected southwestward at about 12 kt. Cell motion appeared to be southwest at about 5 kt with a northeastward propagation mode, suggesting strong inflow on the northern periphery from the northeast trade winds. The cluster also shows some evidence of upper tropospheric divergence. The calculation of a 19 kt headwind is also suggestive of stronger northerly winds at 250 mb south of the system than was indicated by the models.
Above we see an example of the structure in a typical MCS, this one observed on a shipboard experiment in the same general area 35 years ago. It gives some idea of what the aircraft was probably flying through and shows the vertical radar structures that can be expected. The southwest and northeast directions should be reversed for the June 1, 2009 storm complex.
In order to obtain an estimate of instability in the MCS environment, it's important to get as accurate a collection of
surface and upper observations as possible. Unfortunately the coverage of upper air data was extremely poor.
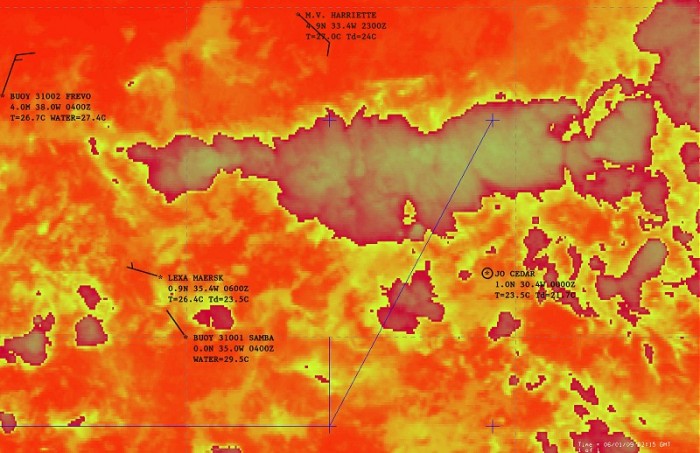
However at the surface, several merchant marine ships and buoys were located in the area.
They show a highly homogenized maritime air mass with a predominant temperature figure of 27.0 deg C.
This is in equilibrium with the reported sea-surface temperature of 27-28 deg C.
There is one report of 23 deg C in rain-cooled outflow air reported by the Jo Cedar ship.
The mesoscale analyses also indicates predominant dewpoint temperatures of 23.5 to 24.0 deg C.
The "worst case" sounding scenario would be the sounding shown above for Fernando de Noronha (SBFN/82400) using a parcel constructed with the dominant 27.0C air temperature observed for that region and for a 23.7 deg C dewpoint, exactly as observed. This yields about the maximum amount of equivalent potential temperature that can be obtained given the atmospheric conditions. The problem is that this method accounts for zero mixing of the parcel, which is unrealistic given the drier air above 2000 ft AGL. The worst-case method also produces extensive -80 deg C overshoots, which were not observed. Since this method yields 1500 J/kg of CAPE, it is believed that CAPE values were not in this range.
Above shows the most-likely parcel as plotted on the Fernando de Noronha (SBFN/82400) sounding for 0000Z. A parcel was constructed that just barely achieves the isolated -80 deg C overshoot temperature detected on METEOSAT imagery. This was readily accomplished with a surface temperature of 27 deg C and dewpoint of 23 deg C (thus it realistically accounts for a certain amount of boundary layer mixing). The CAPE value obtained is 1067 J/kg, which by textbook definition is considered marginal for severe weather and typical for the tropics1. That is not to say it does not have severe weather risks, as the formula for typical maximum observed updraft velocity is: w=0.5*((2*CAPE)^0.5) which in this case gives 23 m/s (51 mph). It is probable that even this amount of instability was not observed, due to the potential for extensive mixing with an average dewpoint of 18C in the lowest 150 mb. Furthermore, researcher Ed Zipser and others in their studies of oceanic equatorial cumulonimbus clouds emphasize the dilution of updraft strength in the clouds they sampled, though this mainly occurs below about FL200. This mid-level weakness probably contributes in some way to the lack of charge separation and electrification (i.e. lightning). Above that level, ice-filled updrafts are warmed by latent heat of sublimation, restrengthening the updraft relative to the surrounding environment and this allows the updraft to regain momentum and the cumulonimbus cloud to reach the stratosphere. Zipser states that updrafts are usually strongest in the upper troposphere compared to lower levels and updraft velocities of 20 to 40 kt do occur occasionally. The role of a strong updraft or turbulence within the storm cannot be completely ruled out, especially since METEOSAT measurement shows that cumulonimbus overshoots reached at least 6,000 ft above the tropopause. This supports the parcel buoyancies indicated in Figure 9 (most probable parcel) at flight level but probably not in the lower part of the storm. Based on the soundings above, my conclusion is that the maximum cumulonimbus tops were 56,000 ft with an equilibrium level of 47,000 ft, representing the tops of most parts of the MCS except near the edges. This agrees fairly well with the observed METEOSAT thermal data.
3. Conclusions (updated June 2011)
There was the potential for a variety of severe weather phenomena to affect Air France Flight 447.
These are addressed specifically as follows:
Air France Flight 447 crossed through an area of tropical showers and/or weak thunderstorms
with weak to moderate updrafts and a high likelihood of turbulence.
The flight penetrated one cell at about 0150 UTC and then entered a cluster of cells beginning at 0158 UTC.
The suspected zone of strongest cells was reached at 0208 UTC, which corresponds with the beginning of a track deviation, and another
cell appeared to be reached at 0210 UTC, which corresponded with the time of autopilot disconnect.
The flight was suspected to be within areas of showers and precipitation up until the time of impact, and the descent below FL250 into the
critical -10 to -20 deg C zone probably involved some degree of clear icing on control surfaces, though it is uncertain whether this affected
recovery of the aircraft, especially due to the short accumulation time that would be involved.
Footnotes
1A reader pointed out
Northwest Flight 705,
a Boeing 720 which broke up in a Florida thunderstorm in 1963, which has been mentioned in
this essay but not yet addressed.
So I decided to create proximity soundings based on the Miami radiosonde launch for
1200 UTC and
0000 UTC (crash time was 1930Z).
This incorporates a parcel constructed from the T=25C Td=22C conditions observed at Miami
and Homestead AFB earlier that morning which is in agreement with the mixed layer parcel moisture value
of about 16 g/kg on the
Key West
sounding.
Averaging the two it appears that a CAPE (instability) value of 1670 J/kg occurred with
these thunderstorms. It's also noteworthy that the parcel-environment temperature difference,
which gives an estimate of updraft severity, was 5 to 7 deg C at FL180-240, which was
slightly more than the 4 deg C seen on the AF447 sounding below.
2I received an e-mail (see the comments page) from a scientist affiliated with the
NASA TRMM mission indicating that no lightning
was detected during a 90-second pass of the system that affected Air France Flight 447.
This agrees with evidence from the
WWLL sferic lightning network for that date.
A review of the literature confirms these findings and suggests that convective systems over the equatorial
oceanic regions do indeed exhibit an unusual lack of lightning activity.
In a 1993
paper
E. J. Zipser cites
"many examples of intense mesoscale systems, such as squall lines ... extending to 1317 km in altitude,
but that nevertheless produce few reports of lightning. This reinforces the idea, based on data from
other tropical ocean regions and from global satellite data, that in spite of the ubiquitous
'hot towers' over tropical oceans, marine cumulonimbus produce little lightning."
Furthermore, a recent paper also published by Zipser
(source)
underscored the dilution of updraft parcels in the lower portions of equatorial oceanic cumulonimbus clouds
while providing an excellent conceptual model for the cloud structure and ice particle
distribution that might have affected Air France 447.
Though lightning or electrical discharge effects cannot be conclusively ruled out, this set of evidence
makes it difficult to offer a coherent explanation predicated on those factors.
I have made some adjustments throughout this study to account for the new information.
3. It was brought to my attention (thanks Bill S.) that a 1979 episode of sudden upper tropospheric
warming has been quantified in the peer-reviewed literature
(for example).
The proposed mechanism is that upper-tropospheric sinking motion occurs due to some sort of
forced circulation caused by the thunderstorm's overshooting tops and the plane would encounter
it in the clear air around the periphery of the storm.
Any sort of intense adiabatic subsidence like this is accompanied by very strong drying and would
be observable not only on coarse infrared
imagery but also water vapor imagery, which is sensitive to the upper troposphere.
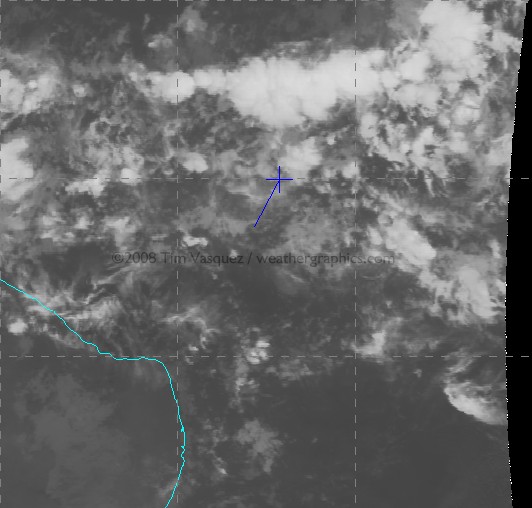
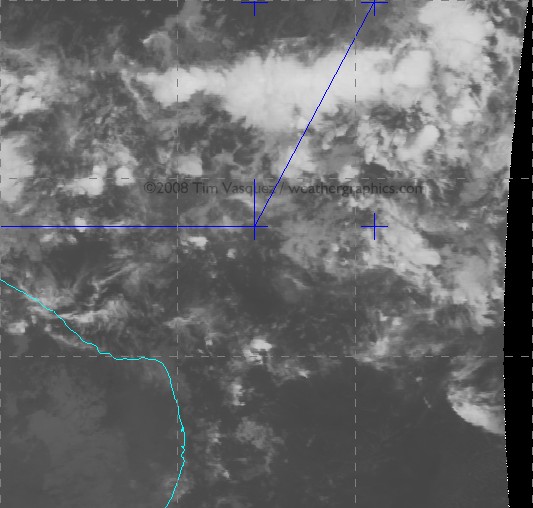
Older imagery (now retired; provided here only for historic interest) » View of AF447 track using GOES imagery, 0215Z 1 June 2009. GOES-10 is located at the 60 deg meridian. [The fundamental data for this image has not changed but as of 2011 the known flight track is has slight differences from that shown here.] » View of AF447 track using METEOSAT-9 imagery, 0200Z 1 June 2009. This satellite is positioned over west Africa at the 0 deg meridian. The image shows slightly different characteristics since the satellite is positioned east of the MCS rather than west of it. The image is also 15 minutes earlier. (Special thanks to Scott Bachmeier and SSEC at the University of Wisconsin; also to EUMETSAT for making the image possible). [The fundamental data for this image has not changed but as of 2011 the known flight track is has slight differences from that shown here.] » Probable radar depiction (green/yellow/red shading) based on thermal signatures and conceptual MCS models. Units are arbitrary approximations of radar strength ranging from green (weak) to red (strong). [The fundamental data for this image has not changed but as of 2011 the known flight track is has slight differences from that shown here.] » Cross-section of MCS from NASA CloudSat. Special thanks to Phil Partain for this graphic. Says Mr. Partain: "One hour and forty-five minutes after the flight's last automated message, CloudSat, a NASA satellite mission that carries a nadir-looking 94 GHz cloud radar passed over the same MCS just to the west of your estimated flight track. The bright line below cloud level is the reflection of the radar off the ocean surface. In areas of heavy precipitation the signal is attenuated as indicated by the disappearance of the surface and anomalous returns extending below the surface caused by multiple scattering of the radar beam. Obviously the heaviest precipitation and strongest updrafts are on the northern side of the storm evidenced by the radar signature at the surface and strong in-cloud echoes extending to or through the tropopause." Full comment with more details is found below on the comments page. (Courtesy NASA CloudSat Project and the Cooperative Institute for Research in the Atmosphere) » Mesoanalysis of buoy and ship reports for 00Z with GOES IR. » Distance/temperature diagrams prepared by Scott Bachmeier: 0130Z, 0145Z, 0200Z, 0215Z along INTOL to TASIL at different times (temperature in deg K) indicating that the minimum cloud top temperature along the flight route averaged -78 deg C (55,000 ft). » NRL satellite photos annotated in June 2009 before the exact track was known: GOES-12 GCD, GOES-12 CTOP, GOES-10 IR, GOES-10 CTOP, GOES-12 IR. Many thanks to NCAR and the Naval Research Laboratory, including Jeff & Rich at NRL, for these images; their message is in the comments and you can visit their website at http://www.nrlmry.navy.mil/sat_products.html. » Atmospheric Infrared Sounder data data courtesy of George Aumann at the Jet Propulsion Laboratory, received 6/5/2009, showing the extent of convective cloud overshoots in the MCS.
» Raw infrared images are also available here:
0145Z,
0200Z,
0215Z,
0230Z.
[Removed from report above as redundant]
» Click here to read e-mail comments from pilots and other professionals (page now retired)
Return to Tim's homepage
| |||||||||||||||||||||||||||||||||||||||||||||||||||||||||||


